


The Most Compelling Chargeback Stats & Dispute Data Points to Know in 2025
If you know anything at all about chargebacks, you know they’re bad news for merchants. How bad? Well, the answer to that question is a little complicated.
Accurate chargeback statistics can be difficult to pin down. Verifiable information on the state of chargebacks is scarce, and the information that is available can be contradictory. It’s hard to paint a detailed picture…but that doesn’t mean we shouldn’t try.
We know that evolving technology and consumer buying preferences have driven a surge in friendly fraud over the last decade. Covid-19 compounded the problem, but it’s still worsening, even in a post-pandemic environment. Now more than ever, merchants need information on the causes, costs, and consequences of chargebacks and friendly fraud.
To help with that, we’ve compiled a list of relevant chargeback stats that present a snapshot of the current situation. We’ve scoured our resources, then cross-referenced the data to make these chargeback statistics as accurate as possible.
reported an increase in friendly fraud chargebacks in 2024
In 2025, every dollar lost to fraud is expected to cost US merchants $4.61. That’s a 37% increase compared to 2020.
In annual losses are expected to hit merchants by 2026 due to chargeback fraud. That’s a 40% increase from 2023.
Were filed on average by each cardholder in 2023, with each dispute valued at $76. Consumers filed more than $65.2 billion worth of disputes in total.
that merchants re-present are won on average, yet they achieve a net recovery rate of only 18%.
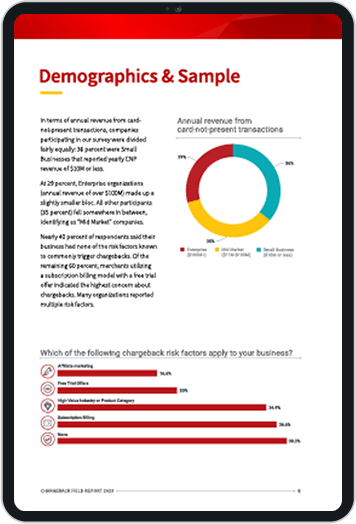
For a deeper dive, download the free Chargeback Field Report from Chargebacks911® and see results from a survey of over 300 merchants of all sizes and industries. But, if you’re just looking for a basic rundown on where we stand today, then read on.
Recommended reading
- What Happens When You Dispute a Transaction?
- Provisional Credits: Here’s Everything You Need to Know.
- Here are the 7 Valid Reasons to Dispute a Charge
- What Happens if You File a False Chargeback Claim?
- A Step-by-Step Guide to the 2025 Chargeback Scheme
- A Step-By-Step Guide to the Chargeback Process in 2025
Second, getting an accurate view would require consolidated input from a range of financial institutions, card networks, and merchants. Unfortunately, stakeholders tend to keep this critical data to themselves.
Learn more about chargebacks
Chargeback Stats
How Do We Know the Threat is Growing?
A solid consensus might not be possible. If that’s the case, though, then how can anyone know if the situation is getting better or worse?
By looking at the raw figures, we can get some clues as to what’s happening. Here are a few of the most revealing statistics available regarding chargebacks, fraud, and the demands of digital-enabled customers:
![]() eCommerce chargeback rates rose 222% between Q1 2023 and Q1 2024.
eCommerce chargeback rates rose 222% between Q1 2023 and Q1 2024.
Sift, Q4 2024 Digital Trust Index
![]() 72% of merchants reported an increase in friendly fraud chargebacks in 2024.
72% of merchants reported an increase in friendly fraud chargebacks in 2024.
Chargebacks911, 2024 Chargeback Field Report
![]() Global chargebacks volume will increase by 41% between 2023 and 2026, from 238 million to 337 million.
Global chargebacks volume will increase by 41% between 2023 and 2026, from 238 million to 337 million.
Mastercard , Mastercard and Worldpay join forces to fight payment fraud globally
![]() In 2024, consumers lost $12.5 billion to fraud, a 25% increase from the figure reported in 2023.
In 2024, consumers lost $12.5 billion to fraud, a 25% increase from the figure reported in 2023.
FTC, New FTC Data Show a Big Jump in Reported Losses to $12.5 billion in 2024
![]() In 2024, the cost of retail returns was $890 billion, canceling out 16.9% of total annual sales. In 2023, merchants reported $743 billion worth of returned merchandise. 13.5% of this total — $101 billion worth of returns — were cases of return fraud.
In 2024, the cost of retail returns was $890 billion, canceling out 16.9% of total annual sales. In 2023, merchants reported $743 billion worth of returned merchandise. 13.5% of this total — $101 billion worth of returns — were cases of return fraud.
NRF, 2024 Consumer Returns in the Retail Industry Report
![]() By 2030, total payment card volume is expected to top $79 trillion. Of that amount, an estimated $49.32 billion will be lost to criminal fraud.
By 2030, total payment card volume is expected to top $79 trillion. Of that amount, an estimated $49.32 billion will be lost to criminal fraud.
Nilson Report, Card Fraud Losses Dip to $28.58 Billion

Chargeback Stats
Rising Costs for Merchants
Merchants bear the burden of chargebacks in a multitude of ways, from chargeback fees and monitoring program surcharges to fraud prevention and detection costs.
As we see in the chargeback stats outlined below, costs are quickly ballooning out of control for merchants:
![]() Friendly fraud chargebacks can account for between 40% and 80% of all eCommerce fraud losses.
Friendly fraud chargebacks can account for between 40% and 80% of all eCommerce fraud losses.
Forbes, How E-Commerce's Explosive Growth Is Attracting Fraud
![]() In 2025, every dollar lost to fraud is expected to cost US merchants $4.61. That’s a 37% increase compared to five years earlier.
In 2025, every dollar lost to fraud is expected to cost US merchants $4.61. That’s a 37% increase compared to five years earlier.
LexisNexis Risk Solutions, True Cost of Fraud Study 2024
![]() By 2026, chargeback fraud is expected to result in $28.1 billion in losses for merchants, a 40% increase from $20 billion in 2023.
By 2026, chargeback fraud is expected to result in $28.1 billion in losses for merchants, a 40% increase from $20 billion in 2023.
Ethoca, 2023 Chargeback Outlook Report
![]() Friendly fraud is now the second most-common fraud attack source that merchants have to deal with. This is up from #3 in 2023.
Friendly fraud is now the second most-common fraud attack source that merchants have to deal with. This is up from #3 in 2023.
Cybersource, 2024 Global Fraud Report
Chargeback Stats
eCommerce Merchants Suffer Most
It’s harder to verify buyers in a card-not-present environment. This is because, in most situations, the merchant never comes in physical contact with the customer or the payment card used.
Fraudsters are opportunistic. They know there are numerous factors and challenges demanding merchants’ attention right now, and they're eager to take advantage of the situation.
The eCommerce channel is very attractive because it’s easier to conduct a high volume of fraud attacks in a short period of time. And, as we see in the chargeback statistics outlined below, merchants are often unable to even see the full scope of the problem:
![]() The cost of third-party eCommerce fraud is expected to increase by 141%, from $44.3 billion in 2024 to $107 billion in 2029.
The cost of third-party eCommerce fraud is expected to increase by 141%, from $44.3 billion in 2024 to $107 billion in 2029.
Juniper Research, eCommerce Fraud to Exceed $107 Billion in 2029
![]() The average chargeback rate for card-not-present eCommerce transactions is between 0.6% and 1%; significantly higher than the 0.5% average fraud rate for card-present transactions.
The average chargeback rate for card-not-present eCommerce transactions is between 0.6% and 1%; significantly higher than the 0.5% average fraud rate for card-present transactions.
PayKings, Average eCommerce Chargeback Rate
![]() Merchants estimate that friendly fraud represents only 45% of their chargebacks on average. Chargeback data shows the rate to be considerably higher.
Merchants estimate that friendly fraud represents only 45% of their chargebacks on average. Chargeback data shows the rate to be considerably higher.
Chargebacks911, Chargeback Field Report
Percentage of Chargebacks Merchants Estimate is Caused by Friendly Fraud
![]() 80% of chargebacks are fraud-related. This includes both third-party (“criminal”) fraud, as well as first-party (“friendly”) fraud.
80% of chargebacks are fraud-related. This includes both third-party (“criminal”) fraud, as well as first-party (“friendly”) fraud.
Cybersource, 2024 Global eCommerce Payments and Fraud Report
![]() eCommerce merchants in the US and Europe spend 10% of their revenue, on average, to manage payment fraud.
eCommerce merchants in the US and Europe spend 10% of their revenue, on average, to manage payment fraud.
Merchants Savvy, Payment Fraud Statistics, Trends and Forecasts 2024
Chargeback Stats
Consumers Are Driving the Problem
Whether deliberate or accidental, cardholders ultimately drive invalid friendly fraud chargebacks. These account for the lion’s share of disputes filed against merchants.
To be clear, invalid chargebacks are not all equally malicious. Accidental friendly fraud occurs when cardholders fail to recognize purchases made by loved ones or billing descriptors on their bank statements. On the other hand, intentional friendly fraud involves buyer’s remorse or refund abuse.
In any case, the chargeback process — while initially established to ensure fair billing practices and protect consumers — now victimizes merchants instead.
![]() In 2023, the average cardholder filed 5.7 chargebacks each valued at $76. In total, consumers filed more than $65.2 billion worth of disputes.
In 2023, the average cardholder filed 5.7 chargebacks each valued at $76. In total, consumers filed more than $65.2 billion worth of disputes.
Chargebacks911, Cardholder Dispute Index
![]() 72% of cardholders consider disputes a valid alternative to refunds.
72% of cardholders consider disputes a valid alternative to refunds.
Chargebacks911, Cardholder Dispute Index
Nearly 3/4 of participants consider disputing a charge a valid alternative to a refund.
![]() 84% of customers prefer filing chargebacks to refunds, while 72% say they do not know the difference between the two payment reversal methods.
84% of customers prefer filing chargebacks to refunds, while 72% say they do not know the difference between the two payment reversal methods.
Ethoca, 2024 Outlook: Strategic Insights for Issuers and Merchants
![]() 57% of merchants say fraud involving buy online, pick up in store (BOPUS), as well as “buy online, return in store” (BORIS), has become a big concern in 2024.
57% of merchants say fraud involving buy online, pick up in store (BOPUS), as well as “buy online, return in store” (BORIS), has become a big concern in 2024.
National Retail Federation, 2024 Impact of Retail Theft and Violence Report
Chargeback Stats
The Merchant Strikes Back
There are numerous tools available to help prevent chargebacks and friendly fraud. However, there is evidence that merchants are not leveraging these tools to their full potential. For example, chargeback alerts are a go-to solution for many merchants. They’re a valuable asset... but should be seen as more of a stop-gap measure.
Long-term chargeback mitigation is the ultimate goal. But, some preventative measures cause collateral damage.
Fraud filters, for instance, are popular among merchants who want to deter disputes and refund abuse. But overly-rigid fraud filters come at a cost; legitimate transactions incorrectly flagged as fraud cause merchants to lose out on 75 times more revenue than fraud itself.
It also erodes customer goodwill: 80% of cardholders who “experienced a false decline said it wasn’t just inconvenient — it was outright embarrassing, especially when it occurred in-store, surrounded by friends, family or strangers.”
![]() 32.4% of merchants use 3-D Secure, 17.8% use RDR, and 26.3% use pre-chargeback alerts to prevent chargebacks.
32.4% of merchants use 3-D Secure, 17.8% use RDR, and 26.3% use pre-chargeback alerts to prevent chargebacks.
Chargebacks911, Chargeback Field Report
![]() Among merchants who engage in chargeback representment, 76% of merchants rely on in-house analysts and managers, rather than getting help from a third-party service.
Among merchants who engage in chargeback representment, 76% of merchants rely on in-house analysts and managers, rather than getting help from a third-party service.
Chargebacks911, Chargeback Field Report
Chargeback reduction solutions currently used
![]() Merchants using automated responses to prevent chargebacks recorded a 33% reduction in chargeback cases.
Merchants using automated responses to prevent chargebacks recorded a 33% reduction in chargeback cases.
Chargebacks911, Chargeback Field Report
![]() 77% of merchants have used card networks compelling evidence rules to reverse first-party misuse disputes.
77% of merchants have used card networks compelling evidence rules to reverse first-party misuse disputes.
Verifi, 2024 Global Fraud Payments Report
![]() Merchants win an average of 45% of the chargebacks they represent, and register a net recovery rate of 18%.
Merchants win an average of 45% of the chargebacks they represent, and register a net recovery rate of 18%.
Chargebacks911, Chargeback Field Report
Net Recovery Rate
The Ideal Chargeback Stat: Zero
Ideally, the best chargeback statistic merchants could hope for is zero… as in zero chargebacks.
That may never be achievable, as there’s no way to guarantee against the occasional oversight or misstep. However, adopting the right chargeback management strategy has been proven to dramatically lower chargeback issuances and boost chargeback success rates.
It’s possible that merchants simply don’t know which steps they should take to mitigate friendly fraud. That said, it’s telling that merchants who recognized friendly fraud as a major concern were more likely to turn to a third-party solution. This translates to increased revenue and a better chance for long-term success and sustainability.
Fighting chargeback fraud requires education. Merchants need reliable chargeback stats to identify where fraud is coming from.
The industry overall needs a more comprehensive data model to serve as a basis for long-term, positive change. Until that happens, however, the only thing merchants can be sure of is that chargebacks—and the resulting revenue loss—will become more and more of a threat.
Ready to forget about chargebacks and get back to the business of running your company? Chargebacks911 can make the chargeback stats work in your favor. Contact us today to see how much you could save.