How to Calculate Your Chargeback Ratio & Save Revenue in the Process
Do you know your chargeback ratio?
This isn’t something to take lightly. Even a slight, temporary change in this number can be costly, and have long-term consequences for your business.
In simple terms, your chargeback ratio is a metric that compares your sales to the number of chargebacks you receive each month. Careful monitoring and analysis of this stat can provide a wealth of helpful information. Knowing all that, it’s surprising that so many merchants have only a vague understanding of how chargeback ratios work.
Recommended reading
- Chargeback Automation | Better Dispute Management
- Revenue Recovery: Tips & Best Practices to Reclaim Money
- What’s an “Acceptable” Chargeback Rate? Why Does it Matter?
- Chargeback Accounting: How it Works | Tips & Best Practices
- Chargeback Reduction Plan: a Guide to Develop Your Strategy
- Chargeback Reports | Use Past Data to Stop Future Disputes
What is a Chargeback Ratio?
- Chargeback Ratio
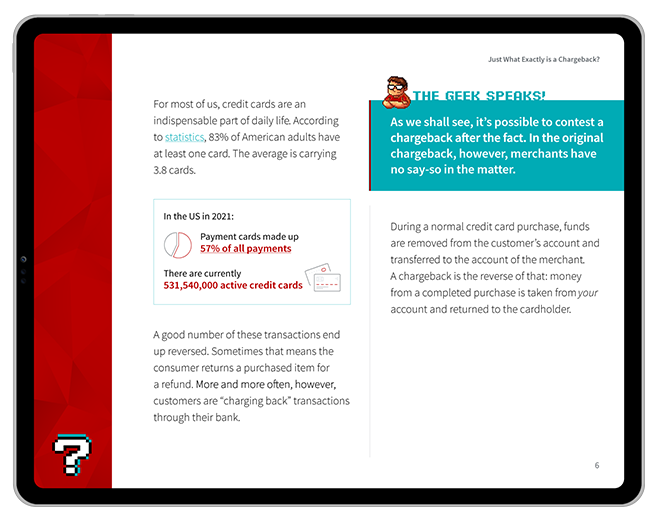
A chargeback ratio is a number comparing the total sales a merchant processes each month with the number of chargebacks the business received during the period in question. Each card brand calculates merchants’ chargeback ratios differently.
[noun]/chahrj • bak • rā • SHē • ō/Your chargeback ratio (also referred to as a chargeback rate) is a key performance indicator used by credit card processors and acquiring banks. This KPI is an assessment of the level of chargeback risk associated with a merchant's account.
Your chargeback ratio explains the portion of transactions processed for the period in question that result in chargebacks. To illustrate, here is how your chargeback ratio is calculated:
So as an example, if you processed 10,000 total transactions in a month, and 50 of those transactions resulted in chargebacks, your chargeback ratio would be 0.5%.
Both Mastercard and Visa use the equation shown above (total monthly chargebacks divided by total monthly transactions). There’s a catch, though; Visa divides your monthly chargebacks by the number of transactions processed during the same month, while Mastercard divides by the number of transactions processed in the previous month.
This chart helps illustrate the difference:
Why Does My Chargeback Ratio Matter?
Your chargeback ratio is a critical metric. It directly influences their relationship with acquiring banks, credit card processors, and the broader payment ecosystem.
Card networks like Visa and Mastercard have predetermined limits for the number of chargebacks considered “acceptable.” Breaching these thresholds can have serious repercussions for your business.
Paying close attention to your chargeback ratio, and keeping it below the thresholds set by card networks, can allow you to avoid:
Chargeback Monitoring
If you breach established chargeback thresholds, you could be placed in a chargeback monitoring program, like the VDMP (for Visa) or the ECM (for Mastercard). This involves heightened scrutiny, additional restrictions, and higher processing fees to continue accepting card payments. You’ll also be subject to costly periodic reviews and audits to verify your business practices and assess risk.Bank Account Freezes or Termination
If the issue persists, and your chargeback ratio remains high over a prolonged period, your acquiring bank may decide to freeze your funds. They do this as a way to insulate themselves against liability for excessive disputes. The bank may even terminate your merchant account altogether. Either action would severely disrupt your operations, affect cash flow, and damage your relationships with customers.Placement on the MATCH List
Perhaps the most severe consequence is being placed on the MATCH List. This list is shared among acquiring banks and processors, and being added to it means you cannot establish a new merchant account with other providers for a minimum of five years. Being MATCHed means your business is essentially blacklisted in the payment processing world, hindering your ability to operate.Chargebacks are a signal to banks, processors, and card networks that you’re not conducting due diligence to prevent fraud or simple mistakes. In contrast, a low chargeback ratio tells banks that you have a well-run business that prioritizes customer satisfaction and comprehensive fraud prevention measures.
A low chargeback ratio can keep you in good standing with financial institutions. It will help ensure operational efficiency, and contribute to the long-term success and reputation of your business.
Other Insights You Can Gain From Your Chargeback Ratio
As mentioned above, your chargeback ratio is a key performance indicator (KPI) for your business.
You can analyze your dispute-to-transaction ratio data based on different values. For example, the issuing bank in question, the cardholder’s geographic location, and the type of merchandise being disputed. Examining the number of chargeback issuances you receive along these axes may give you a fresh perspective on the causes and sources of customer disputes. In turn, you can use this data to identify chargeback triggers and allow for more informed decisioning in fraud detection.
To illustrate, let’s say that you notice your chargeback rate is considerably higher for purchases originating from a certain country or region. If you believe this is indicative of a widespread fraud problem in that region, you might decide to stop accepting orders from that location. Or, if a set of products seem to generate more customer disputes, you might decide to reevaluate how you market those products.
It can be tempting to try and analyze your chargeback ratio based on reason codes. This is usually a bad idea, though. The reason codes used by banks are notoriously inaccurate, with nearly three-quarters of all chargebacks being cases of first-party fraud. The true sources of a chargeback may have nothing to do with the reason code that was used.

Average Chargeback Ratios by Industry
The average chargeback ratio can vary significantly depending on the industry. Different sectors have unique risk profiles, transaction patterns, and customer behaviors.
Here's a general overview of the average chargeback ratios for several industries, collated from recent data published by Clearly Payments and PaymentCloud, as well as our own 2023 Chargeback Field Report:
Understanding the average chargeback ratio in your specific industry is crucial for setting realistic goals and benchmarks for your chargeback management efforts. Implementing industry-specific best practices for fraud prevention, customer service, and transaction processing can help maintain a healthy chargeback ratio, protecting your business's financial health and reputation.
Reduce Your Chargeback Ratio by Adopting Best Practices
It’s crucial that you do everything in your power to prevent chargebacks before they happen. To keep a lower chargeback rate, you must address each chargeback by its fundamental source: merchant error, criminal fraud, or friendly fraud.
There are dozens of best practices you can deploy to keep your chargeback rate at a healthy figure. However, here are ten of the most important practices to implement:
#1 | Minimize Missteps
Avoid merchant errors that could lead to chargebacks by training your staff properly, maintaining accurate records, and ensuring that your product and service descriptions are clear and accurate. Pay attention to every detail of the transaction process to minimize mistakes and misunderstandings.
#2 | Always Secure Authorization
Follow the card issuer's guidelines strictly when obtaining authorization for transactions. Ensure that you request and receive proper authorization for every sale, and do not proceed with the transaction if authorization is declined. This practice helps in preventing unauthorized transactions.
#3 | Use Fraud Detection Tools
Implement various fraud detection tools such as card security codes (CVV), 3-D Secure, and Address Verification Service (AVS). These tools add an additional layer of security to transactions, helping to verify the cardholder's identity.
#4 | Watch for Red Flags
Be vigilant and scrutinize every transaction for signs of potential fraud. Look out for red flags such as multiple orders in a short period, high-value transactions, or orders from countries with high fraud rates.
#5 | Prioritize Contact Information
Ensure that your contact information is easily accessible and visible to your customers. Providing clear and multiple channels of communication helps in resolving issues quickly and efficiently. Also, ensure that your customer service is responsive and accessible.
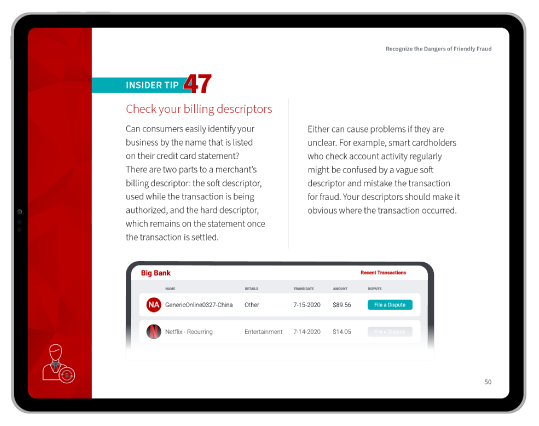
#6 | Use Clear Billing Descriptors
Use clear and recognizable billing descriptors on customers' statements. Including contact information in the descriptor can also be helpful. This practice reduces confusion and helps customers recall the transaction, preventing chargebacks due to unrecognized charges.
#7 | Check Your Advertising
Regularly review your advertising materials, product descriptions, and photos to ensure accuracy and clarity. Misleading or inaccurate information can lead to customer dissatisfaction, so it’s crucial to set proper expectations through your marketing.
#8 | Promptly Process Refunds
If a refund is requested, process it promptly and inform the cardholder of the expected timeline for the credit to appear on their account. Quick and transparent handling of refunds can prevent chargebacks by ensuring customers that they have not been forgotten or ignored.
Implementing these practices requires effort and diligence. The payoff in maintaining a healthy chargeback ratio is well worth it, though.
Interested in further expertise and strategies to prevent, fight, and win more chargebacks? Chargebacks911® offers a comprehensive solution to help you protect your business and keep your chargeback ratio low. Don't let chargebacks undermine your success — take action today to secure your operations and reputation.
FAQs
What is a good chargeback ratio?
There’s no concrete answer. However, “good” chargeback ratio could be seen as anything below 0.5%, indicating a strong capability to minimize disputed transactions and effectively manage customer dissatisfaction. Maintaining a lower ratio can result in more favorable relationships with payment processors and banks, potentially leading to lower transaction fees and a reduced risk of financial penalties.
What is the average chargeback ratio?
The average chargeback ratio varies across industries, typically ranging from 0.5% to 1%, with certain high-risk sectors experiencing even higher averages. This ratio reflects the proportion of transactions that result in chargebacks, serving as a benchmark for merchants to assess their performance in managing customer disputes and fraud.
How do you calculate chargeback ratio?
Your chargeback ratio explains the portion of transactions processed for the period in question that result in chargebacks. It’s calculated by taking your total number of transactions in the period in question, and dividing by the number of chargebacks you receive during that period.
To illustrate, let’s say you processed 10,000 total transactions in a month, and 50 of those transactions resulted in chargebacks. If that’s the case, your chargeback ratio would be 0.5%.
What is the average chargeback rate by industry?
The average chargeback ratio varies significantly by industry, influenced by factors like transaction volume, product type, and susceptibility to fraud. High-risk industries, such as travel, electronics, and digital goods, tend to experience higher average chargeback ratios, often exceeding 1%. Conversely, lower-risk sectors like utilities, food and beverage, and health services generally maintain lower ratios, typically below 0.5%.
How many chargebacks is too many?
A chargeback ratio exceeding 1% is considered too high by most payment processors and banks, potentially putting businesses at risk of facing financial penalties, increased scrutiny, or even termination of their payment processing abilities. However, some industries and payment providers may have even stricter standards, necessitating a lower chargeback ratio to avoid negative consequences.


