
Top 10 eCommerce Stats from Meeker’s ‘Internet Trends 2018’ Report
Every year, venture capitalist and Kleiner Perkins Caufield & Byers partner Mary Meeker produces the highly-anticipated Internet Trends report.
This in-depth presentation covers new tech, investment prospects, international finance, and much more. We’ve delved into the report to find the most interesting eCommerce-specific facts and stats.
Here are ten figures from this year's report that we feel will have the biggest impact on your business over the next year and beyond:

3.6 Billion: The number of people around the world with home internet access.
3.6 billion people—roughly half of the population of the planet—now enjoy access to the internet in their own home. That’s a remarkable change, with the internet transforming from a luxury of the wealthiest economies around the world to a global utility in less than a decade.
Not everyone with internet access is a regular eCommerce shopper, of course, but the potential is still massive. The opportunities will only continue to grow as more consumers around the globe join the digital market.

7%: Annual growth rate for new internet users.
The rate of growth in new internet users is slowing every year, down from 12% YoY growth just two years ago. Of course, growth in the smartphone market has seen an even more dramatic drop off: while 2010 saw 70% YoY expansion in global smartphone use, market growth was completely flat in 2017.
That sounds bad, but it’s actually very good news. Slowed growth in both internet penetration and smartphone adoption are signs that the industry is maturing. And along with a more mature online environment comes greater stability for the eCommerce marketplace as well.
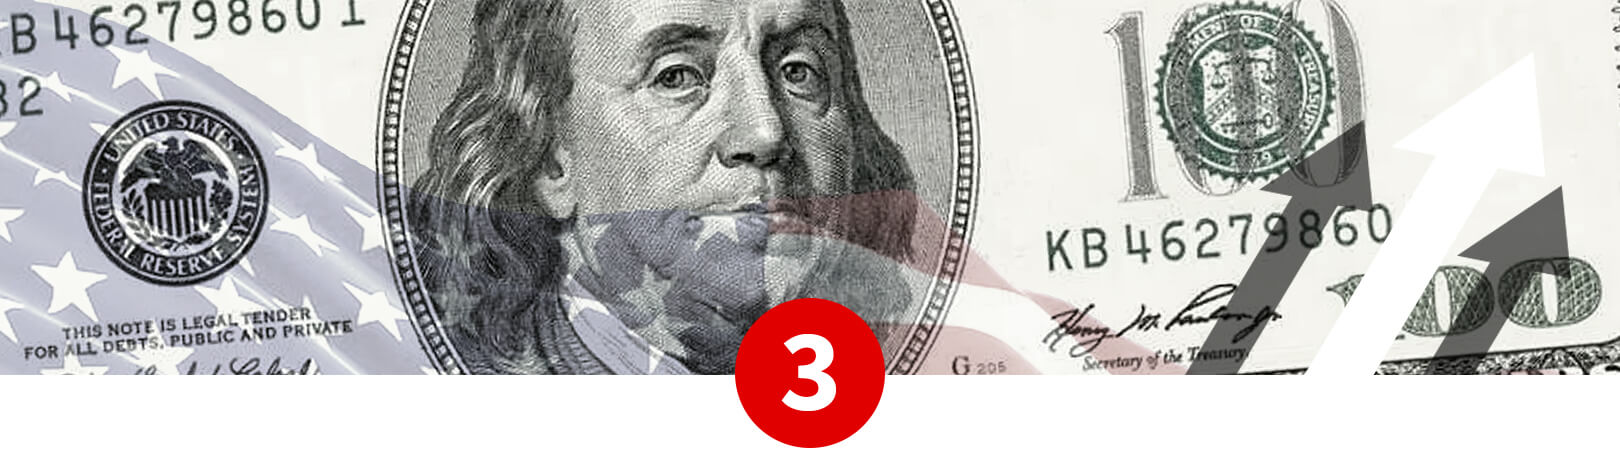
16%: Annual eCommerce growth in the US market.
While the rate of new users getting online is slowing, eCommerce sales are showing strong growth from one year to the next. In 2016, eCommerce in the US saw a 14% YoY growth rate; that figure increased to 16% in 2017.
Total online sales in the US market in 2017 totaled approximately $450 billion, up from roughly $390 billion the year before. Compare that against slowing internet adoption rate, and you have one obvious conclusion: consumers are transferring more of their purchasing power to online channels.
More Opportunities…More Risk?
Maximize your digital sales without increasing risk. Find out more.


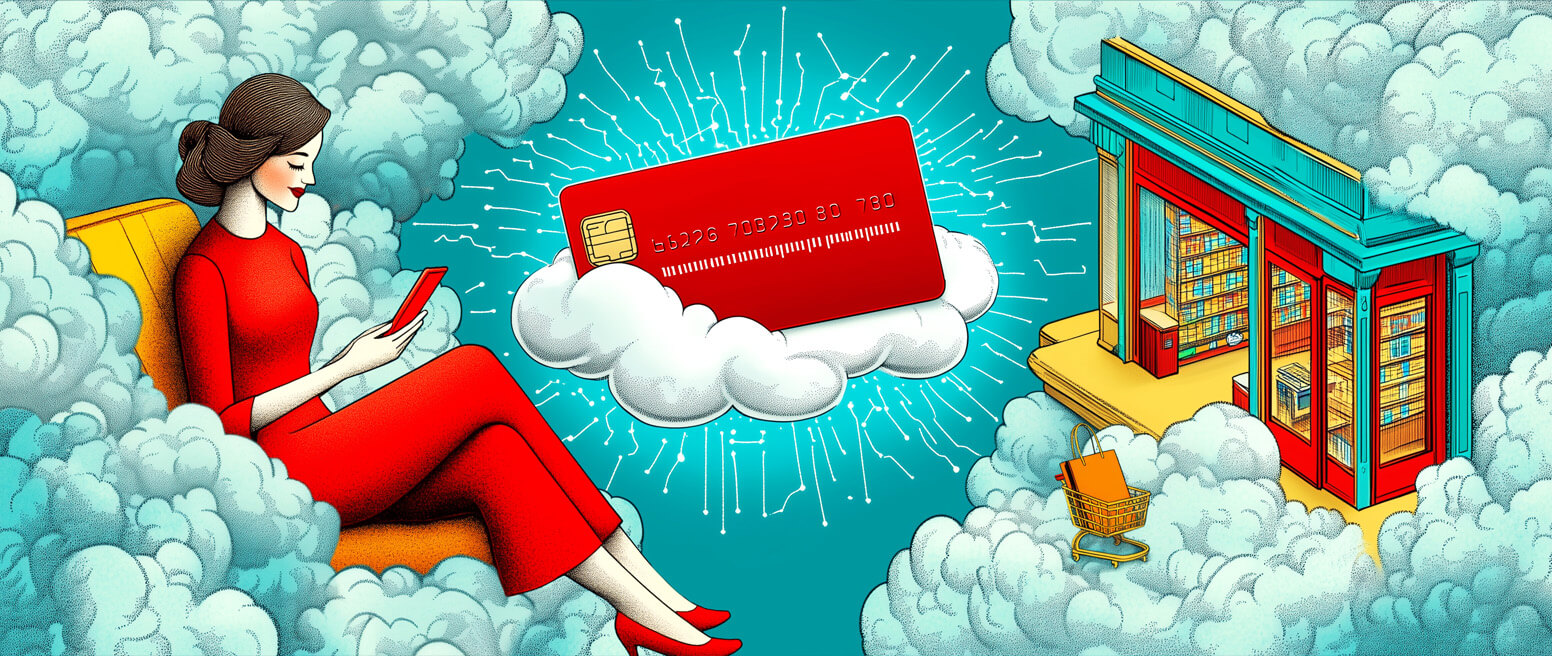
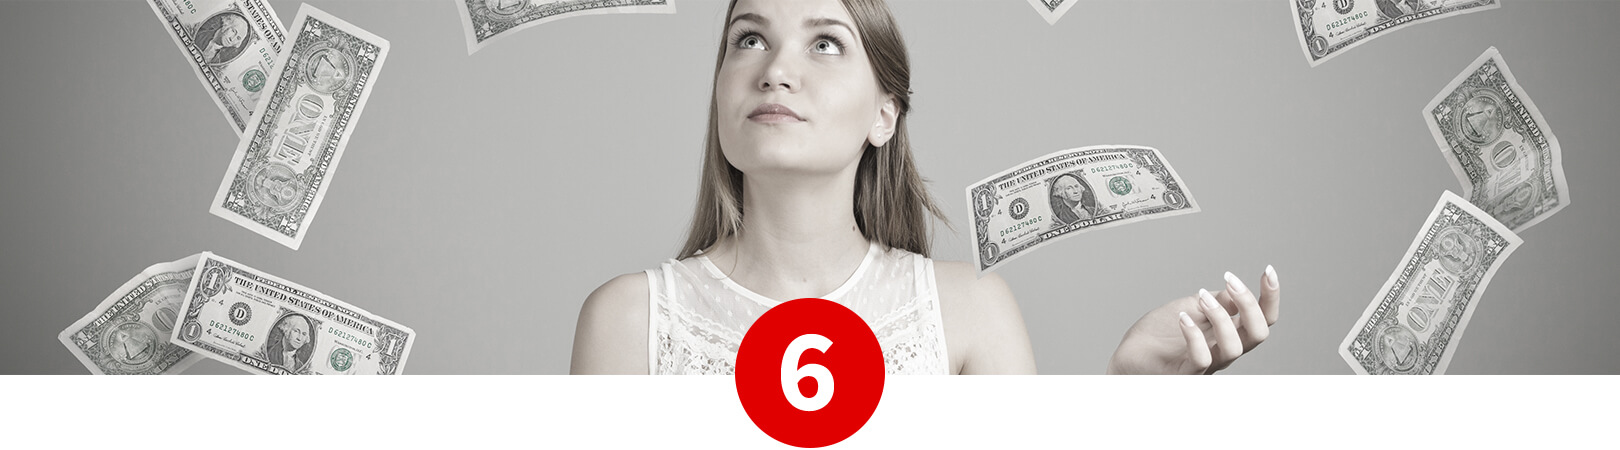
6 of 10: The share of the average consumer’s last 10 purchases that were made through digital channels.
That’s right: only four out of the average global consumer’s last ten transactions were conducted using a standard card-present exchange. Sixty percent of those transactions involved a digital payment of some kind:
- Other Online Channel: 15%
- Buy Button: 9%
- Mobile Payment App: 8%
- P2P Transfer: 7%
- Mobile Messenger Apps: 7%
- Other In-App Payments: 4%
- QR Codes: 4%
- Smart Home Device: 3%
- Wearables: 2%
- Other: 1%
That’s a remarkable difference compared to just a few years ago: cash and card-present transactions no longer have hegemony over payments. An incredible range of options is available to consumers, and people are showing an increased interest in exploring these technologies. Right now, nearly one in three transactions anywhere around the globe can be attributed to mobile payments technologies.
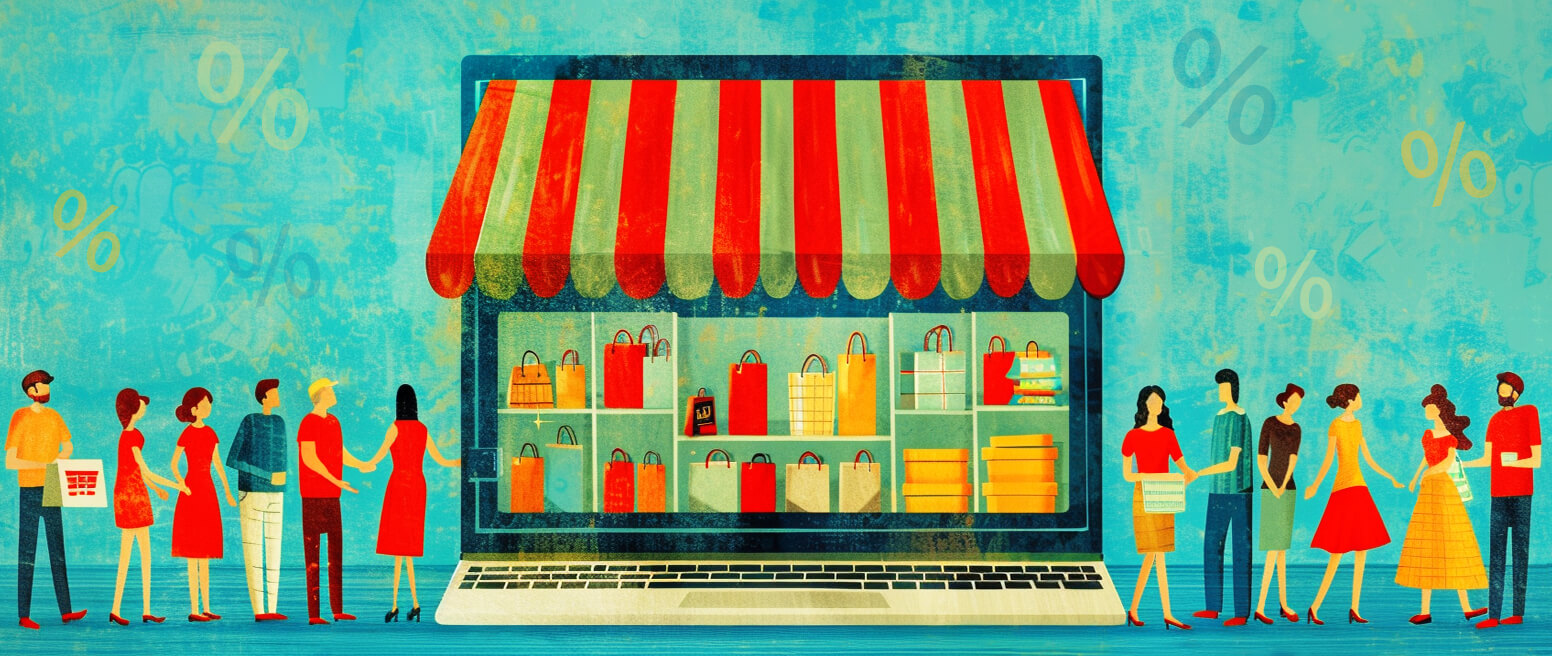
13%: eCommerce as a percentage of total retail sales
eCommerce purchases represented 13% of all US retail sales in 2017. That may not seem significant at first glance, but given that projected total US retail sales last year came to $4.99 trillion, that puts total eCommerce spending at $648 billion.
What’s more telling than the total spend, however, is the growth rate: eCommerce sales represented barely 5% of all retail purchases in 2007. To put it another way, online retailers’ share of the market nearly tripled in the last decade.
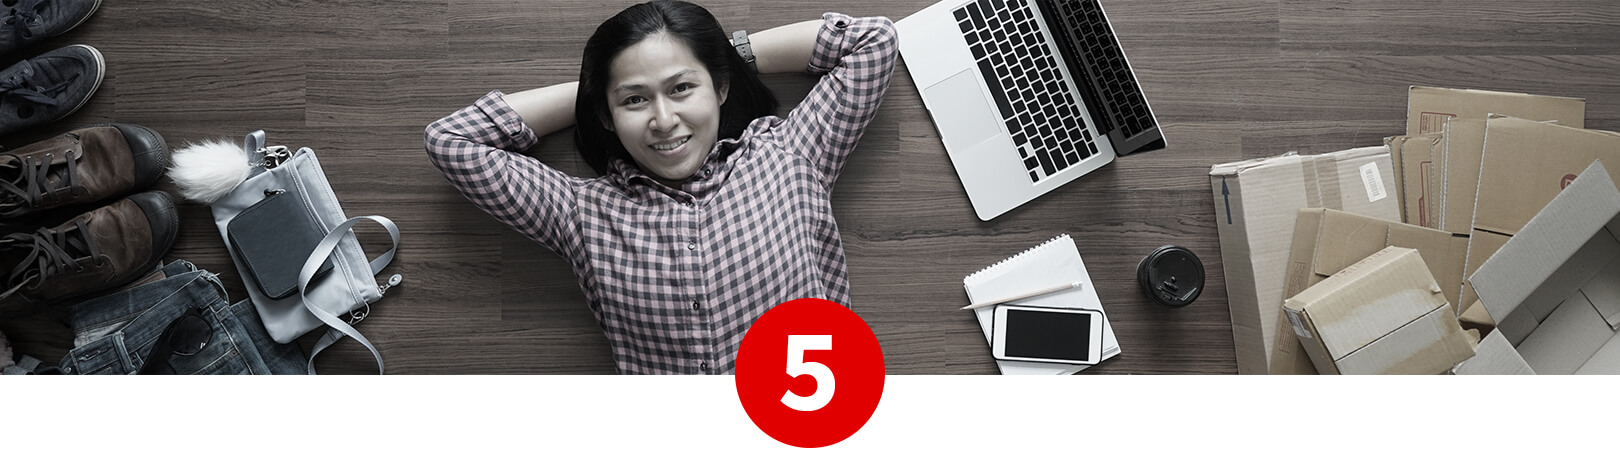
27%: Share of merchants who consider customer lifetime value the most important ad spend metric
Merchants rely on multiple indicators to help optimize their ad spend, but customer lifetime value, or LTV, is increasingly taking center-stage. This makes sense: after all, when determining how much it should cost to acquire a new customer, what metric could be more telling than the amount that customer will spend over the long-term?
The second most-valued metric was impressions/web traffic (19%), followed closely by brand recognition (18%).

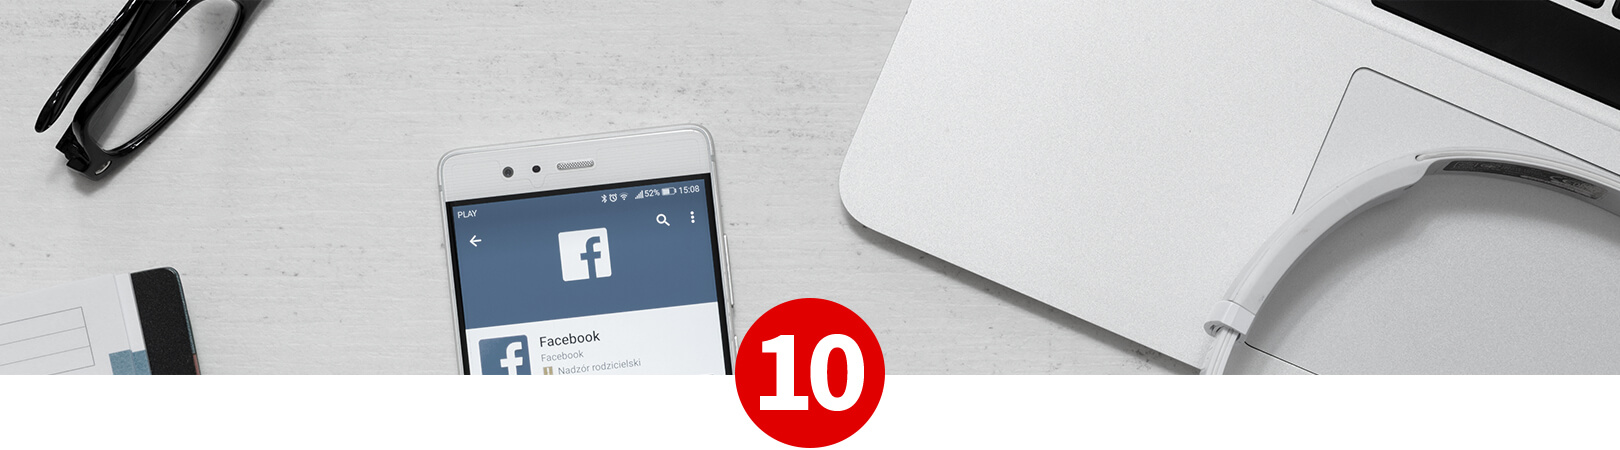
49%: Percent of US consumers who begin a product search on Amazon
Regardless of where a consumer ultimately completes a purchase, the mega-retailer Amazon tends to be the place for consumers to start their search. Amazon represents 28% of total US eCommerce…which suggests that around one-in-four buyers will start their search on Amazon, then ultimately purchase from a third-party.
When not turning to Amazon, 36% of buyers begin with a search engine like Google, while another 15% of US buyers start their search on some other website.

5.9: Number of hours an average adult spends with digital media every day
The average American adult spends nearly six hours every day engaging with digital content. 3.3 of those hours are via mobile channels, while another 2.1 hours involve a desktop/laptop computer. Other tools, such as video game consoles and IoT-connected devices, account for the remaining 0.6 hours.
This is a substantial increase in just the last decade. Back in 2008, the average American adult interacted with digital content for just 2.7 hours per day--less than half of what we do today. That means opportunities for reaching consumers and building relationships through content are expanding like never before.


55%: Share of customers who bought an item after discovering it on social media
This figure speaks to the general power of social marketing and influence at the "discovery" phase of the buying cycle. Over 50% of consumers buy a product after finding it on social media, but only about 1/5 of those customers bought the item at the time they discovered it; the remaining 4/5 of buyers returned to make the purchase at a later date.
That demonstrates the staying power of social discoveries. Of course, to get the most leverage from this, you’ll need to create dynamic, interesting content that engages people, keeping your product at the forefront of customers’ minds and reinforcing the desire to buy.
78%: Share of customers who’ve discovered products via Facebook
Facebook is still the king of social media from an impression standpoint, but a presence on other big-name platforms like Twitter, Instagram, and Snapchat are also essential if you hope to reach your customers. The number of buyers who’ve discovered products on each of these platforms breaks down like this:
- Facebook: 78%
- Instagram: 59%
- Pinterest: 59%
- Twitter: 34%
- Snapchat: 22%
Of course, how you should allocate resources across different platforms will vary based on the dynamics of your business. If your clientele is mostly Millennial and Gen-Z shoppers, for example, then Snapchat will probably be more of a priority, while professional consumers may best be reached via LinkedIn.
Good Times Can Be Yours
The future is bright for eCommerce…but you won’t get to enjoy it if you can’t manage your risk. Ready to reduce your costs, recover revenue, and increase your net income? Click below and start saving today.