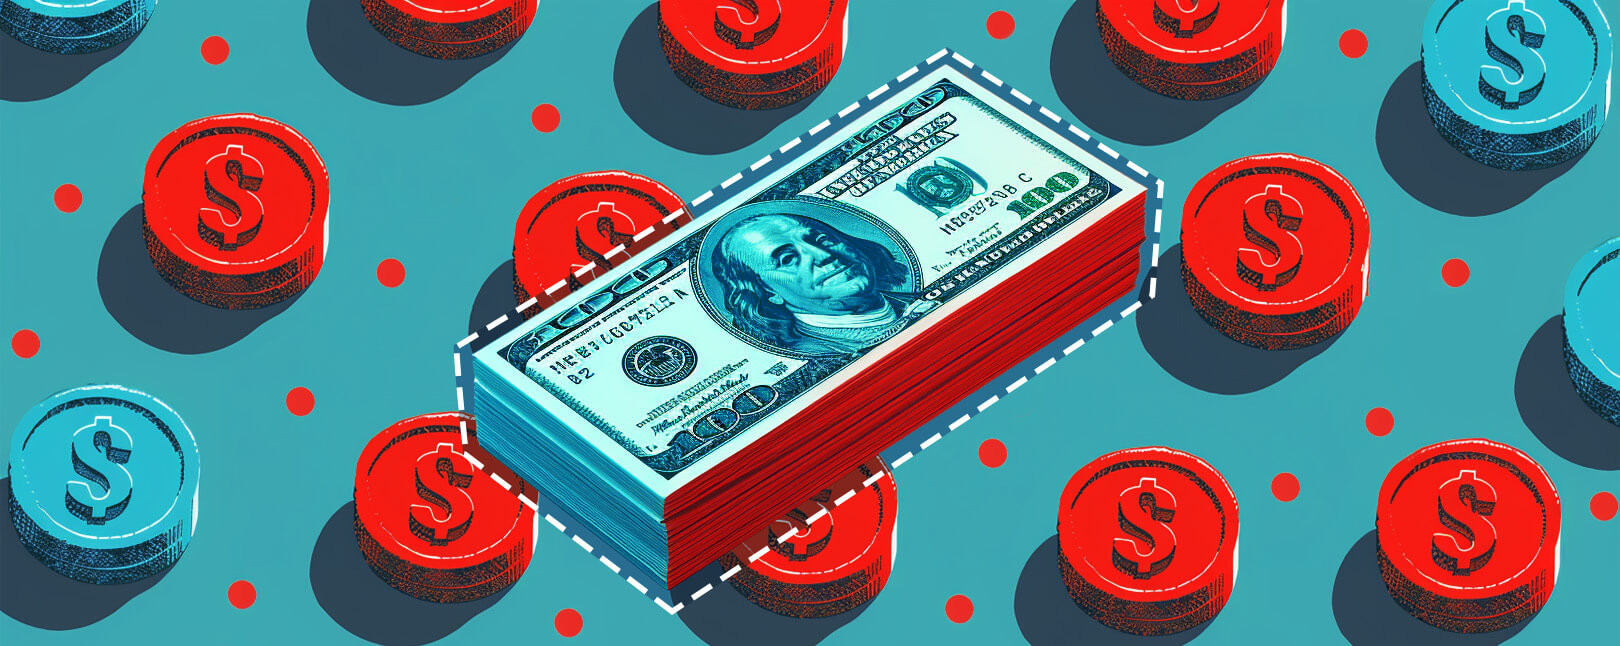
If you know anything at all about chargebacks, you know they’re bad news for merchants. How bad? Well, the answer to that question is a little complicated.
Accurate chargeback statistics can be difficult to pin down. Verifiable information on the state of chargebacks is scarce, and the information that is available can be contradictory. It’s hard to paint a detailed picture…but that doesn’t mean we shouldn’t try.
We know that evolving technology and consumer buying preferences have driven a surge in friendly fraud over the last decade. Covid-19 compounded the problem, but it’s still worsening, even in a post-pandemic environment. Now more than ever, merchants need information on the causes, costs, and consequences of chargebacks and friendly fraud.
To help with that, we’ve compiled a list of relevant chargeback stats that present a snapshot of the current situation. We’ve scoured our resources, then cross-referenced the data to make these chargeback statistics as accurate as possible.
For a deeper dive, download the free 2022 Chargeback Field Report from Chargebacks911® and see results from a survey of over 300 merchants of all sizes and industries. But, if you’re just looking for a basic rundown on where we stand today, then read on.
Recommended reading
- 3 Types of Payment Reversals: What’s the Difference?
- Provisional Credits: Here’s Everything You Need to Know.
- Here are the 5 Valid Reasons to Dispute a Charge
- 14 Chargeback Facts Exposing the Threat of Fraud in 2024
- How are Partial Chargeback Different From Other Disputes?
- Late Presentment: Why You MUST Submit Transactions on Time
Why are Chargeback Stats So Hard to Find?
The chargeback system was designed to be a “last resort” for consumers. The aim was to protect cardholders from criminal fraud and merchant abuse. It still functions in that role today. However, eCommerce dramatically changed the way we shop, and the chargeback process has failed to keep pace.
Deceitful or uninformed consumers have turned chargebacks into a tool to commit fraud, rather than prevent it. More and more merchants around the world are losing revenue to this threat.
It’s not surprising that people are at least trying to find some reliable chargeback data to help understand the problem. That said, the data that does exist is hard to trust. This is true for a couple of reasons.
First, not everyone collecting information is using the same merchant fraud statistics. For example, chargebacks that are considered “criminal fraud” by one source may be labeled “friendly fraud” by another.
The other reason is simply the number of parties involved in the chargeback process. Obtaining an accurate view would require consolidated input from a range of financial institutions, card networks, and merchants. Unfortunately, stakeholders tend to keep this critical data to themselves.
This is partly out of concern for security. But, it’s also true that many merchants simply don’t want people to know that chargebacks are a problem for them.
That caution is not totally baseless. Chargebacks have a negative perception; businesses don’t want to be associated with them. However, the lack of information creates a kind of feedback loop. The more the various parties try to control their data, the more they muddy the waters.
Chargeback Stats
How Do We Know the Threat is Growing?
Like we mentioned above, a detailed consensus might not be possible. If that’s the case, though, then how can anyone know if the situation is getting better or worse?
By looking at the raw figures, we can get some clues as to what’s happening. Here are a few of the most revealing statistics available regarding chargebacks, fraud, and the demands of digital-enabled customers:
![]() 75% of eCommerce businesses saw an increase in fraud attempts in 2021.
75% of eCommerce businesses saw an increase in fraud attempts in 2021.
Statista, Share of online merchants reporting increased fraud attempts...
![]() From 2020 to 2021, fraud risk more than doubled for retail and social networking brands. Fraud risk more than tripled for primarily eCommerce brands, and quadrupled for SaaS, gaming, and streaming brands.
From 2020 to 2021, fraud risk more than doubled for retail and social networking brands. Fraud risk more than tripled for primarily eCommerce brands, and quadrupled for SaaS, gaming, and streaming brands.
Bolster, 2022 State of Phishing and Online Fraud Report
![]() The US registered 847,376 online fraud complaints in 2021. That number is expected to reach a record 1.11 million in 2022; a 31.5% YoY increase.
The US registered 847,376 online fraud complaints in 2021. That number is expected to reach a record 1.11 million in 2022; a 31.5% YoY increase.
Atlas VPN, Online fraud complaints in the US
![]() eCommerce losses resulting from criminal fraud were as high as $20 billion dollars globally in 2021.
eCommerce losses resulting from criminal fraud were as high as $20 billion dollars globally in 2021.
Juniper Research, Fighting Online Payment Fraud In 2022 & Beyond
![]() By 2030, total payment card volume is expected to top $79 trillion. Of that amount, an estimated $49.32 billion will be lost to criminal fraud.
By 2030, total payment card volume is expected to top $79 trillion. Of that amount, an estimated $49.32 billion will be lost to criminal fraud.
Nilson Report, Card Fraud Losses Dip to $28.58 Billion
![]() Customer returned $428 billion in merchandise—more than 10% of US retail sales—in 2020. Roughly 6% of these returns were fraudulent. All totaled, merchants saw $25.3 billion in return fraud losses that year.
Customer returned $428 billion in merchandise—more than 10% of US retail sales—in 2020. Roughly 6% of these returns were fraudulent. All totaled, merchants saw $25.3 billion in return fraud losses that year.
NRF, $428 Billion in Merchandise Returned in 2020

Chargeback Stats
Rising Costs for Merchants
Fraud represents a substantial source of loss for merchants. However, most underestimate how much is really at stake.
The cost of the individual transaction is just a fraction of the total cost of a single fraud incident. We also need to factor in lost merchandise, overhead expenses like shipping and interchange fees, plus chargeback fees assessed by the bank.
As we see in the chargeback stats outlined below, costs are quickly ballooning out of control for merchants:
![]() Merchants lose an average of $3.75 for every $1 lost to fraud. This is due to added fees, increased overhead, and other losses associated with chargebacks.
Merchants lose an average of $3.75 for every $1 lost to fraud. This is due to added fees, increased overhead, and other losses associated with chargebacks.
LexisNexis Risk Solutions, True Cost of Fraud Study 2022
![]() By 2023, the average cost of a single chargeback is expected to be $190, based on a $90 average transaction value.
By 2023, the average cost of a single chargeback is expected to be $190, based on a $90 average transaction value.
Chargebacks911, 2022 Chargebacks Costs
![]() Friendly fraud is now reportedly the #1 fraud attack source that merchants have to deal with. This is up from #5 in 2019.
Friendly fraud is now reportedly the #1 fraud attack source that merchants have to deal with. This is up from #5 in 2019.
Cybersource, 2021 Global Fraud Report
![]() Friendly fraud chargebacks can account for between 40% and 80% of all eCommerce fraud losses.
Friendly fraud chargebacks can account for between 40% and 80% of all eCommerce fraud losses.
Forbes, How E-Commerce's Explosive Growth Is Attracting Fraud
Chargeback Stats
eCommerce Merchants Suffer Most
Chargeback volume has been increasing year over year for more than a decade. No merchant is invulnerable, but card-not-present merchants are the hardest hit by far.
It’s harder to verify buyers in a card-not-present environment. This is because, in most situations, the merchant never comes in physical contact with the customer or the payment card used.
Fraudsters are opportunistic. They know there are numerous factors and challenges demanding merchants’ attention right now, and they're eager to take advantage of the situation.
The eCommerce channel is very attractive because it’s easier to conduct a high volume of fraud attacks in a short period of time. And, as we see in the chargeback statistics outlined below, merchants are often unable to even see the full scope of the problem:
![]() More than three-quarters of all fraud incidents in 2021 occurred in card-not-present channels.
More than three-quarters of all fraud incidents in 2021 occurred in card-not-present channels.
UK Finance, Annual Fraud Report 2021
![]() By 2023, six out of ten chargebacks issued in North America will be cases of friendly fraud.
By 2023, six out of ten chargebacks issued in North America will be cases of friendly fraud.
Chargebacks911, 2022 Chargebacks Costs
![]() Merchants estimate that friendly fraud represents only 42% of their chargebacks on average. Chargeback data shows the rate to be considerably higher.
Merchants estimate that friendly fraud represents only 42% of their chargebacks on average. Chargeback data shows the rate to be considerably higher.
Chargebacks911, 2022 Chargeback Field Report
![]() 80% of chargebacks are fraud-related. This includes both third-party (“criminal”) fraud, as well as first-party (“friendly”) fraud.
80% of chargebacks are fraud-related. This includes both third-party (“criminal”) fraud, as well as first-party (“friendly”) fraud.
Mastercard, Chronicles of the New Normal...
![]() One-quarter of online shoppers say they've disputed a transaction in the last 12 months.
One-quarter of online shoppers say they've disputed a transaction in the last 12 months.
PYMNTS, Tackling the Chargeback Surge...
Chargeback Stats
Consumers Are Driving the Problem
A growing majority of chargebacks can be traced back to invalid disputes; a practice known as friendly fraud.
Some consumers commit friendly fraud unintentionally. They may genuinely misunderstand the chargeback process, and dispute a charge without knowing the consequences of their actions. Other consumers do it on purpose; a practice known as cyber-shoplifting.
Intentional or not, consumers have the highest chargeback success rate, and merchants pay the price.
![]() More than 80% of consumers freely admit that they’ve filed a chargeback out of convenience.
More than 80% of consumers freely admit that they’ve filed a chargeback out of convenience.
Chargebacks911, 2018 Consumer Survey
![]() Consumers who file a chargeback are 9 times more likely to do it again. 40% will try it again within 60 days.
Consumers who file a chargeback are 9 times more likely to do it again. 40% will try it again within 60 days.
Chargebacks911, 2018 Consumer Survey
![]() Cardholders are officially required to contact the merchant before filing a chargeback. However, fewer than 15% actually do so.
Cardholders are officially required to contact the merchant before filing a chargeback. However, fewer than 15% actually do so.
Chargebacks911, 2018 Consumer Survey
![]() Fraud affects 7% of all “buy online, pick up in store” (or “BOPUS”) transactions. This is a fraud rate that’s 52% higher than traditional delivery channels.
Fraud affects 7% of all “buy online, pick up in store” (or “BOPUS”) transactions. This is a fraud rate that’s 52% higher than traditional delivery channels.
ACI Worldwide, 2021 ACI eCommerce Fraud Index
![]() Nearly half of all chargebacks start as simple misunderstandings. In many cases, the cardholder was not even aware they were initiating a chargeback.
Nearly half of all chargebacks start as simple misunderstandings. In many cases, the cardholder was not even aware they were initiating a chargeback.
Chargebacks911, 2018 Consumer Survey
The problem here is rooted in the chargeback system itself.
Chargebacks are easy to abuse. As a result, cardholders can exploit loopholes to demand their money back without a valid chargeback reason.
Friendly fraud is first-person consumer fraud. Contrast this with criminal fraud, which is third-person criminal activity. Friendly fraud is easy to conceal by claiming that a transaction was the result of criminal fraud. This makes identifying friendly fraud difficult because merchants have limited data insight, and are forced to rely on faulty and unreliable reason codes.
Chargeback Stats
The Merchant Strikes Back
Card-not-present transactions carry greater inherent chargeback risk. These chargebacks can be genuine, just as easily as they may be fraudulent. This makes chargeback triggers a lot harder to locate.
This does not mean that merchants are helpless, though. There are numerous tools available to help prevent chargebacks and friendly fraud. However, there is evidence that merchants are not leveraging these tools to their full potential. In some cases, their efforts are actually doing more harm than good.

For example, chargeback alerts are a go-to solution for many merchants. They allow merchants to intercept disputes before claims escalate to the chargeback stage. The merchant can then refund the transaction and avoid a chargeback. This is a valuable asset, but it should be seen as more of a stop-gap measure.
Long-term chargeback prevention is the goal for which merchants should aim, but not every tool is equally effective. Many merchants utilize fraud filters to identify potentially fraudulent transactions. But in setting parameters too tightly, false declines end up costing US merchants nearly $70 in lost sales for every $1 in preventable fraud.
![]() Although a reported 72% of merchants respond to chargebacks, the average net win rate is slightly under 9%
Although a reported 72% of merchants respond to chargebacks, the average net win rate is slightly under 9%
Chargebacks911, 2022 Chargeback Field Report
![]() Merchants using automated network inquiry programs (Verifi Order Insight, Ethoca Consumer Clarity) reported an average 24% reduction in chargebacks.
Merchants using automated network inquiry programs (Verifi Order Insight, Ethoca Consumer Clarity) reported an average 24% reduction in chargebacks.
Chargebacks911, 2022 Chargeback Field Report
![]() Merchants using alerts programs (Verifi CDRN, Ethoca Alerts, Cb911 Enhanced Alerts) claimed an average 27% reduction in chargebacks.
Merchants using alerts programs (Verifi CDRN, Ethoca Alerts, Cb911 Enhanced Alerts) claimed an average 27% reduction in chargebacks.
Chargebacks911, 2022 Chargeback Field Report
![]() On average, merchants using 3rd-party chargeback prevention tools limit their losses to 0.32% of revenue. In contrast, businesses relying solely on in-house resources lost nearly 0.5% of revenue.
On average, merchants using 3rd-party chargeback prevention tools limit their losses to 0.32% of revenue. In contrast, businesses relying solely on in-house resources lost nearly 0.5% of revenue.
PYMNTS, Dispute Prevention Solutions...
![]() On average, merchants implementing the Visa Rapid Dispute Resolution (RDR) tool saw a 34% reduction in chargeback issuances.
On average, merchants implementing the Visa Rapid Dispute Resolution (RDR) tool saw a 34% reduction in chargeback issuances.
Chargebacks911, 2022 Chargeback Field Report
The Ideal Chargeback Stat: Zero
Ideally, the best chargeback statistic merchants could hope for is zero…as in zero chargebacks.
That may never be achievable, as there’s no way to guarantee against the occasional oversight or misstep. However, adopting the right chargeback management strategy has been proven to dramatically lower chargeback issuances and boost chargeback success rates.
It’s possible that merchants simply don’t know which steps they should take to mitigate friendly fraud. That said, it’s telling that merchants who recognized friendly fraud as a major concern were more likely to turn to a third-party solution. This translates to increased revenue and a better chance for long-term success and sustainability.
Fighting chargeback fraud requires education. Merchants need reliable chargeback stats to identify where fraud is coming from.
The industry overall needs a more comprehensive data model to serve as a basis for long-term, positive change. Until that happens, however, the only thing merchants can be sure of is that chargebacks—and the resulting revenue loss—will become more and more of a threat.
Ready to forget about chargebacks and get back to the business of running your company? Chargebacks911 can make the chargeback stats work in your favor. Contact us today to see how much you could save.